
LIME for ML Models: 5-Step Guide
LIME helps me explain one model prediction at a time - but I should never treat one explanation as proof that the model is right.
If I use LIME on tabular ML models, the process is simple: I pick one row, create nearby samples, score them with the original model, fit a small local model, and read which features pushed that one prediction up or down. That makes LIME useful for single-case review in areas like lending, fraud, and health risk scoring.
Before I use any LIME output in review notes, I need to check four things:
- Stability: do results change across random seeds?
- Local fit: does the surrogate match the black-box model well enough?
- Sample quality: did perturbations create rows that make no sense?
- Scope: am I labeling this as a row-level explanation only?
Here’s the short version:
- LIME is model-agnostic, so I only need model outputs
- It explains one row at a time, not the whole model
- Coefficients show local association, not cause
- Bad signs include unstable outputs, low local fit, leakage, and proxy features
- I should pair LIME with model metrics, drift checks, and bias review before sign-off
A useful rule for me is simple: if the same row gets different top drivers across runs, I should not rely on that explanation in a review file.
That is the core of this guide, and it frames how I should use LIME with care in model review work.
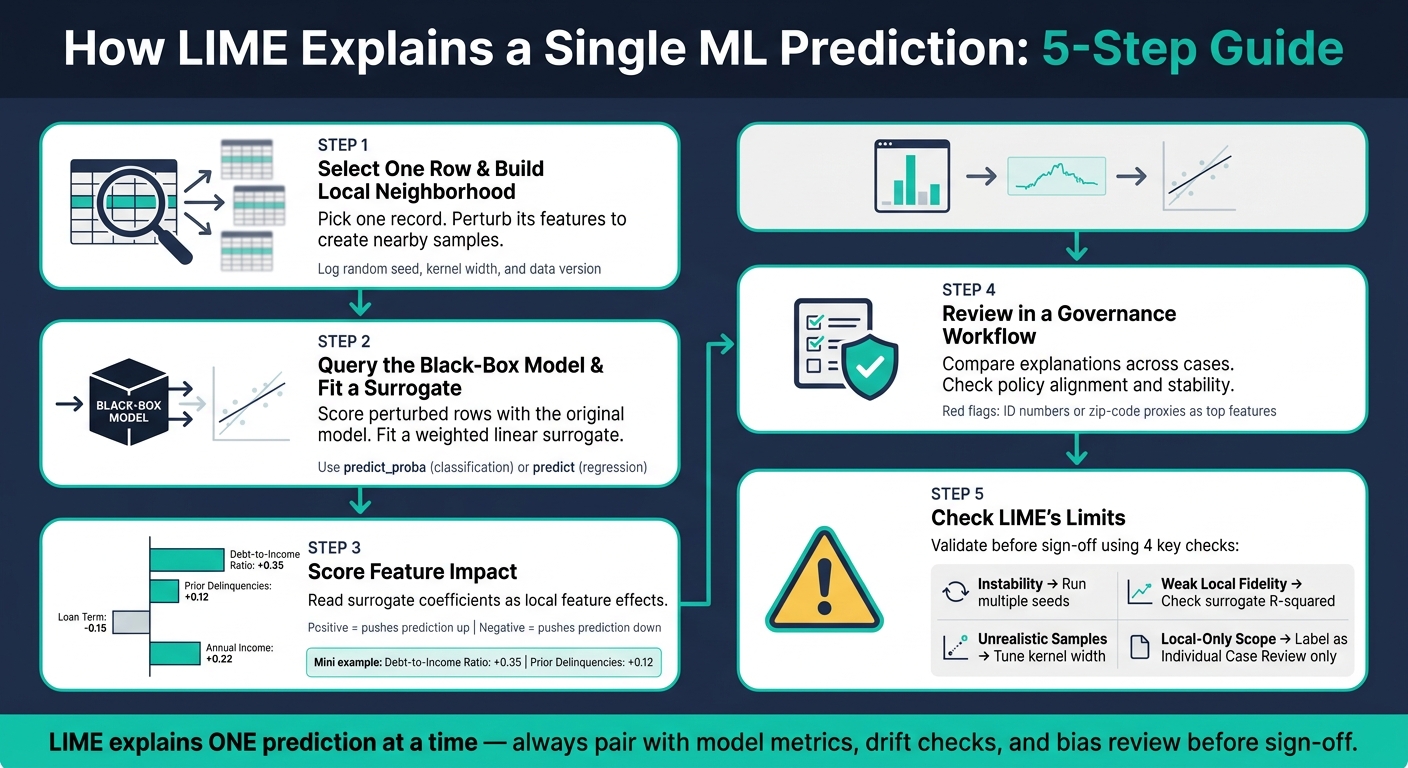
LIME for ML Models: 5-Step Explanation Process
Steps 1 and 2: Sample Local Data and Train the Surrogate Model
Step 1: Select One Row and Build a Local Neighborhood
Pick the single record you want to explain.
LIME then perturbs that row’s features to create a set of nearby samples. That local sample set becomes the input for Step 2.
Use the same preprocessing pipeline that was used during training. Also log the random seed, kernel width, and data version so the process can be reproduced later.
Step 2: Query the Black-Box Model and Fit a Weighted Surrogate
Next, run each perturbed row through the black-box model. Use the original model output method: predict_proba for classification and predict for regression. LIME doesn’t need to know how the model works inside the box. It only needs the outputs.
Then LIME gives higher weight to samples that sit closer to the original row, and lower weight to those that are farther away. The kernel width decides how fast those weights drop off.
With those weighted samples, LIME fits a surrogate model, usually a simple linear model, to estimate local feature effects for that one prediction. Those fitted weights are then used in Step 3 to read the local feature impact.
sbb-itb-61a6e59
An introduction to LIME for local interpretations | Intuition and Algorithm |
Step 3: Score Feature Impact for One Prediction
In Step 3, you read the surrogate model’s coefficients as local feature effects. That gives you a simple way to see which features pushed this one prediction up or down.
Read Coefficients as Local Feature Effects
A positive coefficient pushes the local prediction up. A negative coefficient pushes it down.
To spot the biggest drivers for this row, rank features by their absolute coefficient values. That sorted view gives you your first read on what mattered most in this single case.
Use a Feature-Impact Table to Connect Scores to Business Meaning
A small table makes those effects much easier to review in plain business terms. It helps reviewers see, at a glance, what drove this specific decision.
| Feature | Direction of Effect | Local Contribution | Business Meaning |
|---|---|---|---|
| Debt-to-Income Ratio | Positive | +0.35 | High debt relative to income raised default risk most for this applicant. |
| Prior Delinquencies | Positive | +0.12 | Past delinquencies also raised risk, but less than debt-to-income ratio. |
Be careful with direction. The surrogate shows association inside the local neighborhood, not causation. So when you record a local effect, spell that out clearly. A negative coefficient does not prove cause and effect. It only shows a local push away from the prediction.
Step 4: Review LIME Outputs in a Model Governance Workflow
After you read feature impact for one prediction, the next step is to compare that explanation with other cases and your policy rules. In high-stakes settings, LIME should be treated as one piece of evidence, not the whole story. Use it inside a structured governance review to check whether local effects line up with policy and domain expectations.
Compare Explanations Across Key Cases
Look at LIME explanations side by side for contrasting cases: approved versus declined applications, flagged versus non-flagged transactions, or high-risk versus low-risk patients. Then check whether the top contributing features are the ones your domain experts and policy rules would expect to see.
Put simply, reviewing LIME across cases helps you spot drivers that feel off.
| Case Category | Reviewer Check | Potential Red Flag |
|---|---|---|
| Approved vs. Denied | Compare top 3 features against policy | Model relies on features that should be neutral (e.g., ID numbers) |
| Flagged vs. Non-Flagged | Verify if top features align with fraud detection rules | Top features unrelated to transaction behavior (data leakage) |
| High-Risk vs. Low-Risk | Check for proxy bias in demographic-adjacent features | Zip code or similar proxies appearing as high-impact factors |
If a credit model shows an account ID or a zip-code proxy as its top feature, that's a red flag. Features like that can point to data leakage, bad joins, proxy bias, or plain old data quality issues.
Document Reproducibility and Review Evidence
Before a model gets sign-off, your team should check whether explanations stay stable across different random seeds. If the coefficients move a lot every time you rerun LIME on the same row, the local surrogate isn't reliable enough to serve as governance evidence.
Here’s a practical way to log that review work:
| Case Type | Top Features (LIME) | Explanation Stability (Across Seeds) | Policy Alignment Check |
|---|---|---|---|
| Approved Application | Income, Credit Score, Debt-to-Income | High | Aligns with lending policy |
| Declined Application | Recent Delinquency, Low Tenure | Medium | Check for proxy bias/leakage |
| Flagged Transaction | Location Mismatch, High Amount | High | Matches fraud detection rules |
| High-Risk Patient | Age, Comorbidities, Lab Results | High | Aligns with clinical guidelines |
It also helps to log LIME settings in your MLOps pipeline so every explanation is traceable during an audit review. Tools like MLflow or DVC can help. That record becomes part of the model’s audit trail: proof that a human reviewer checked the explanation, confirmed stability, and verified policy alignment before the model was approved for use.
Even when this evidence is stable, it still has limits. Step 5 covers where LIME stops being reliable.
Step 5 and Conclusion: Check LIME's Limits and Apply It Responsibly
Step 5: Understand the Limits of Local Surrogate Explanations
After you review one case, pause and ask a simple question: is this explanation steady enough to trust?
LIME has four main limits in tabular review: instability, low fidelity, unrealistic samples, and local-only scope.
The biggest issue is instability. LIME builds its local neighborhood with random perturbations, so if you run it twice on the same row without a fixed seed, you can get different feature scores. That means one run isn't enough if you're using the output as review evidence.
Another risk is weak local fidelity. In nonlinear models, a linear surrogate may not match the local decision boundary very well. If the surrogate's R-squared is low, the explanation isn't dependable, even if the coefficients look neat on the page.
Then there's the feature correlation problem. By default, LIME perturbs features independently. In tabular data, that can create synthetic rows that may never show up in actual data. When that happens, the feature attribution can get pulled off course.
And one more point matters a lot: LIME is row-level only. It explains one prediction at a time. A feature that matters for one row may not matter across the full population. So don't take a local explanation and stretch it into a claim about overall model behavior.
Good Practice Checklist and Key Takeaways
Use these limits as a final review gate before sign-off.
Before you place any LIME output into a model review document, run these minimum checks:
| Limitation | Practical Impact in Tabular ML | Mitigation Strategy in Model Review |
|---|---|---|
| Instability | Different feature impacts for the same row across runs | Run multiple random seeds; report variance in feature scores |
| Weak Local Fidelity | Surrogate doesn't match the black-box model's local output | Report R-squared of the surrogate; tune neighborhood size |
| Unrealistic Samples | Perturbations create data points that can't exist in practice | Tune kernel width; check for feature correlation violations |
| Local-Only Scope | A local trend gets mistaken for global model behavior | Label all outputs explicitly as "Individual Case Review" |
The main discipline here is pretty plain: use LIME for individual-case review, not as a standalone explanation of how a model behaves overall.
That means:
- Test stability across seeds before signing off on any explanation
- Tune neighborhood settings with care
- Pair LIME outputs with performance metrics, data drift monitoring, and bias checks before making any governance decision
Use LIME as one input for individual-case review, not as the final word on the model.
FAQs
When should I use LIME instead of a global explanation?
Use LIME when you need to understand why a model made one specific prediction, not how it behaves overall.
Global explanations sum up the model as a whole, but they can miss what’s happening in a single case. That’s where LIME helps. It’s useful during model review when you want to check whether one output lines up with expected domain logic or when you’re trying to debug a prediction that seems off.
How many LIME runs should I compare for stability?
The available results don't say how many LIME runs you should compare to check stability.
In this 5-step LIME guide, that means we can't give a fixed run count like 10, 30, or 100 unless a source backs it up. We also don't have a source that gives an acceptance rule for stability.
So the gap is simple: none of the available results provide either a run count or a pass/fail criterion for stability.
What does a low local fit mean for my explanation?
A low local fit means LIME’s surrogate model isn’t tracking the original model very well around the specific data point you’re looking at.
So the explanation is less dependable. Treat the feature importance output with caution, because it may not show how the original model actually made that prediction.